Monitoring using Prometheus
Example prometheus.yml
lakeFS exposes metrics through the same port used by the lakeFS service, using the standard /metrics path.
An example could look like this:
prometheus.yml
Metrics exposed by lakeFS
By default, Prometheus exports metrics with OS process information like memory and CPU. It also includes Go-specific metrics such as details about GC and a number of goroutines. You can learn about these default metrics in this post.
In addition, lakeFS exposes the following metrics to help monitor your deployment:
| Name in Prometheus | Description | Labels |
|---|---|---|
api_requests_total |
lakeFS API requests (counter) | code: http status method: http method |
lakefs_concurrent_requests |
Number of concurrent requests being processed by lakeFS (gauge) | service: "api" or "gateway" operation: name of operation |
api_request_duration_seconds |
Durations of lakeFS API requests (histogram) | operation: name of API operation code: http status |
gateway_request_duration_seconds |
lakeFS S3-compatible endpoint request (histogram) | operation: name of gateway operation code: http status |
blockstore_concurrent_operations |
Number of concurrent blockstore operations (gauge) | operation: blockstore operation name blockstore_type: type of blockstore (s3, gs, azure, etc) |
s3_operation_duration_seconds |
Outgoing S3 operations (histogram) | operation: operation name error: "true" if error, "false" otherwise |
gs_operation_duration_seconds |
Outgoing Google Storage operations (histogram) | operation: operation name error: "true" if error, "false" otherwise |
azure_operation_duration_seconds |
Outgoing Azure storage operations (histogram) | operation: operation name error: "true" if error, "false" otherwise |
kv_request_duration_seconds |
Durations of KV requests(histogram) | operation: name of KV operation type: KV type(dynamodb, postgres, etc) |
dynamo_request_duration_seconds |
Time spent doing DynamoDB requests | operation: DynamoDB operation name |
dynamo_consumed_capacity_total |
The capacity units consumed by operation | operation: DynamoDB operation name |
dynamo_failures_total |
The total number of errors while working for kv store | operation: DynamoDB operation name |
pgxpool_acquire_count |
PostgreSQL cumulative count of successful acquires from the pool | db_name default to the kv table name (kv) |
pgxpool_acquire_duration_ns |
PostgreSQL total duration of all successful acquires from the pool in nanoseconds | db_name default to the kv table name (kv) |
pgxpool_acquired_conns |
PostgreSQL number of currently acquired connections in the pool | db_name default to the kv table name (kv) |
pgxpool_canceled_acquire_count |
PostgreSQL cumulative count of acquires from the pool that were canceled by a context | db_name default to the kv table name (kv) |
pgxpool_constructing_conns |
PostgreSQL number of conns with construction in progress in the pool | db_name default to the kv table name (kv) |
pgxpool_empty_acquire |
PostgreSQL cumulative count of successful acquires from the pool that waited for a resource to be released or constructed because the pool was empty | db_name default to the kv table name (kv) |
pgxpool_idle_conns |
PostgreSQL number of currently idle conns in the pool | db_name default to the kv table name (kv) |
pgxpool_max_conns |
PostgreSQL maximum size of the pool | db_name default to the kv table name (kv) |
pgxpool_total_conns |
PostgreSQL total number of resources currently in the pool | db_name default to the kv table name (kv) |
Example queries
Note
when using Prometheus functions like rate or increase, results are extrapolated and may not be exact.
99th percentile of API request latencies
50th percentile of S3-compatible API latencies
Number of errors in outgoing S3 requests
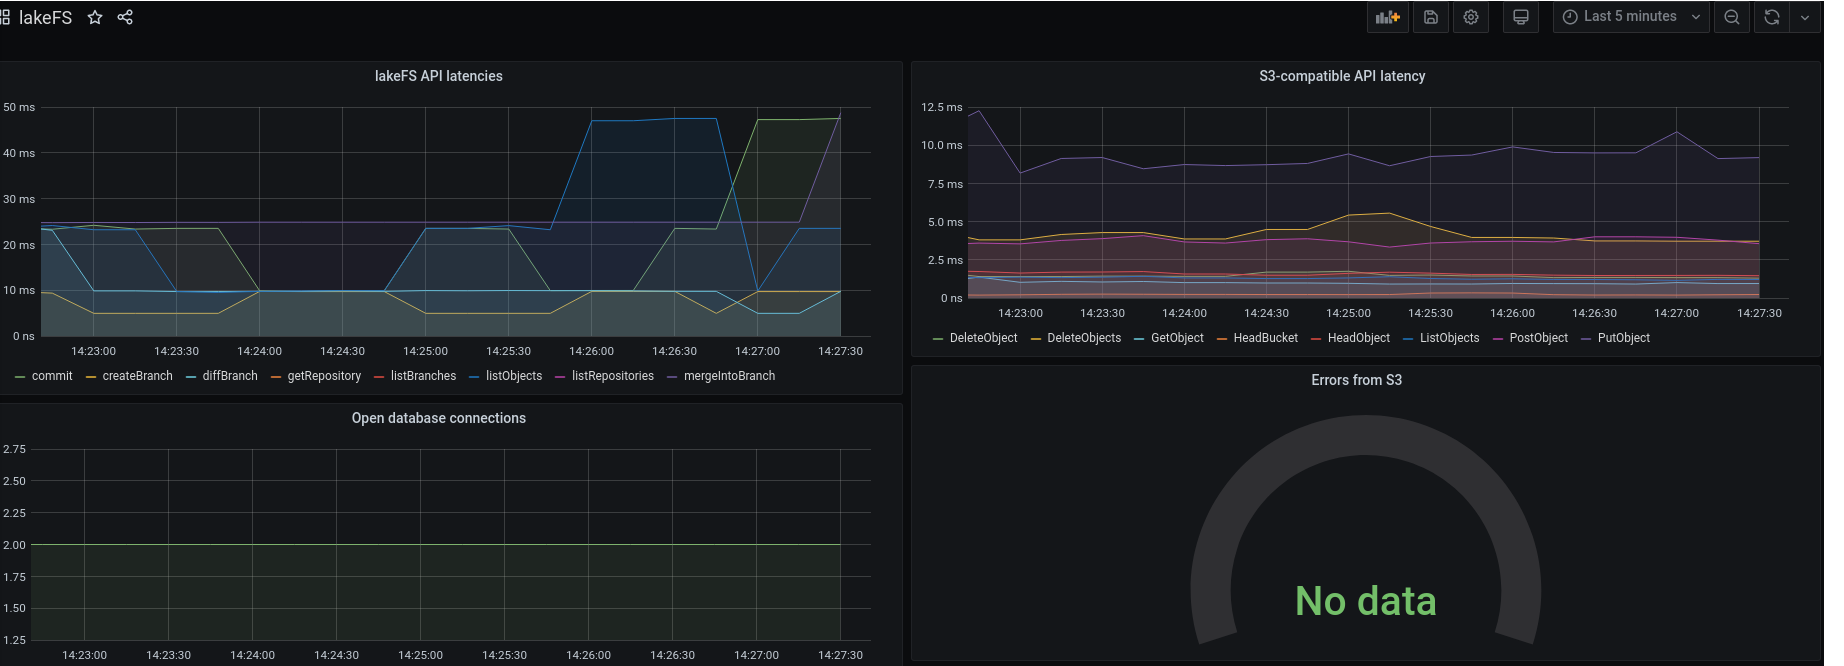
Example Grafana dashboard