Monitoring using Prometheus
Example prometheus.yml
lakeFS exposes metrics through the same port used by the lakeFS service, using the standard /metrics path.
An example prometheus.yml could look like this:
scrape_configs:
- job_name: lakeFS
  scrape_interval: 10s
  metrics_path: /metrics
  static_configs:
  - targets:
    - lakefs.example.com:8000
Metrics exposed by lakeFS
By default, Prometheus exports metrics with OS process information like memory and CPU. It also includes Go-specific metrics like details about GC and number of goroutines. You can learn about these default metrics in this post.
In addition, lakeFS exposes the following metrics to help monitor your deployment:
| Name in Prometheus | Description | Labels |
| api_requests_total | lakeFS API requests (counter) | code: http status method: http method |
| api_request_duration_seconds | Durations of lakeFS API requests (histogram) | operation: name of API operation code: http status |
| gateway_request_duration_seconds | lakeFS S3-compatible endpoint request (histogram) | operation: name of gateway operation code: http status |
| s3_operation_duration_seconds | Outgoing S3 operations (histogram) | operation: operation name error: “true” if error, “false” otherwise |
| gs_operation_duration_seconds | Outgoing Google Storage operations (histogram) | operation: operation name error: “true” if error, “false” otherwise |
| azure_operation_duration_seconds | Outgoing Azure storage operations (histogram) | operation: operation name error: “true” if error, “false” otherwise |
| go_sql_stats_* | Go DB stats metrics have this prefix. dlmiddlecote/sqlstats is used to expose them. |
Example queries
Note: when using Prometheus functions like rate or increase, results are extrapolated and may not be exact.
99th percentile of API request latencies
sum by (operation)(histogram_quantile(0.99, rate(api_request_duration_seconds_bucket[1m])))
50th percentile of S3-compatible API latencies
sum by (operation)(histogram_quantile(0.5, rate(gateway_request_duration_seconds_bucket[1m])))
Number of errors in outgoing S3 requests
sum by (operation) (increase(s3_operation_duration_seconds_count{error="true"}[1m]))
Number of open connections to the database
go_sql_stats_connections_open
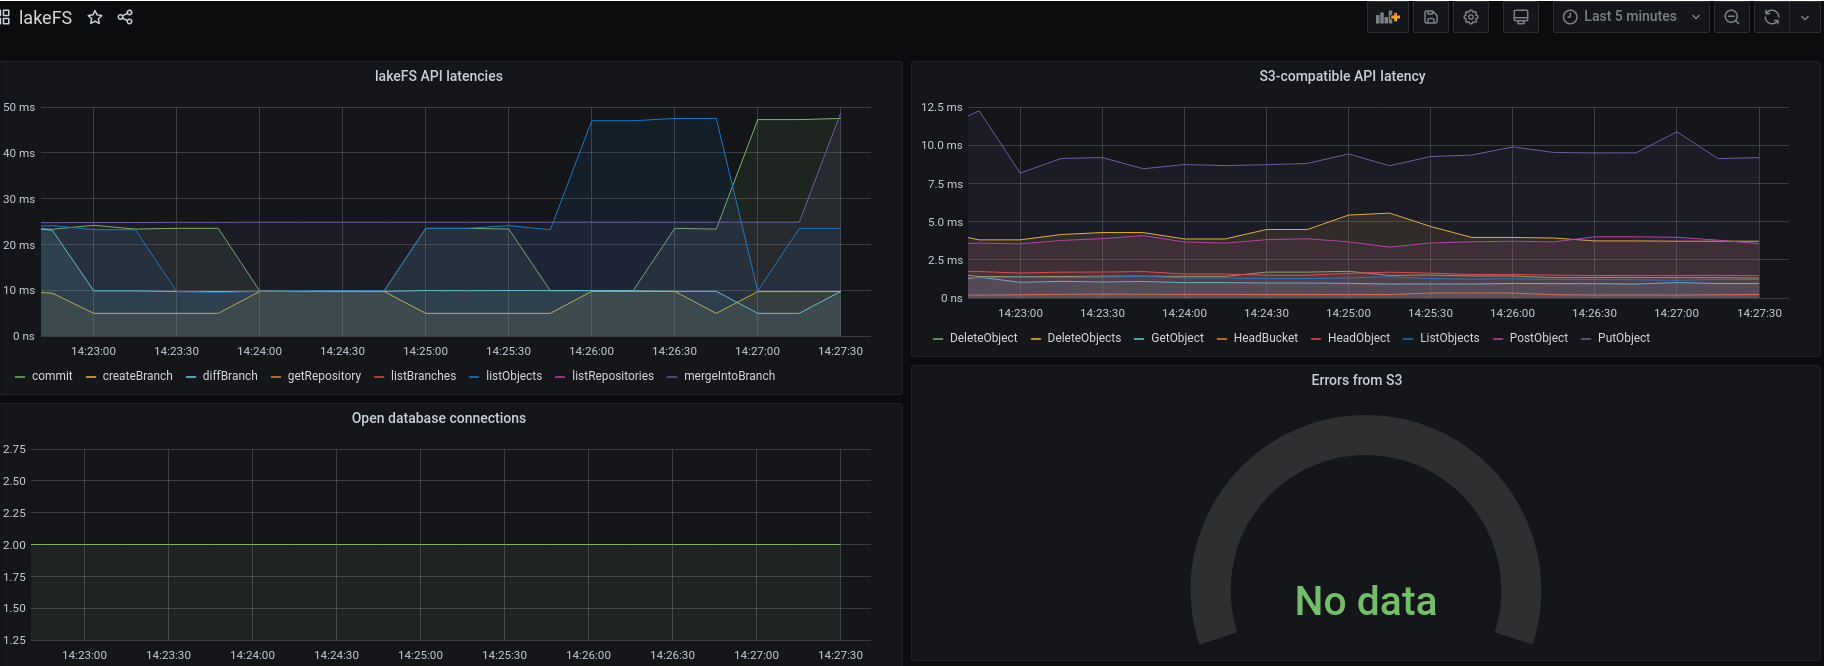
Example Grafana dashboard